Market In a Snap! May 15th-May 19th, 2023

By: Dave Chenet, CFA, CAIA

 CloseWeekly returnYTD return
    
S&P 5004,193.201.64%9.18%
Nasdaq Composite12,664.303.04%20.94%
Russell 2,0001,773.721.91%0.95%
Crude Oil71.772.72%-10.58%
US Treasury 10yr Yield3.69%  

Source: YCharts, Yahoo! Finance, WSJ

Market Recap: Is the Tech Trade Back?

After leading the markets to the downside last year, US large-cap stocks have been the best performer year-to-date.  The equal-weighted S&P 500 index is +1.14% for the year vs. a +9.44% rally for the market-cap weighted S&P 500 index.  On a single stock basis, Nividia and Meta (formerly Facebook) have more than doubled in value over the course of the year.  Two main factors are responsible for the rally in tech shares:

  1. The AI Boom: investors have been enamored with companies that may be exposed to the wave on Artificial Intelligence (AI) applications.  An analysis by Societe Generale finds that removing the 20 stocks most widely owned by AI-focused funds would reduce the S&P 500 performance by roughly 10% year-to-date).
  • Expectations of an Upcoming Fed Pivot:  Despite efforts from Chairman Powell and other Fed presidents to convince the markets that the Fed may indeed continue to hike rates if inflation does not return to the 2% level, the market expects central bankers will soon be cutting rates.  Current market pricing reflects the assumption that the Fed will cut short-term borrowing costs by 0.5% by year-end.  This shift to (more) accommodative monetary policy will likely benefit the interest-rate sensitive technology sector.

Investors may be well served to closely examine their risk tolerance and time horizon before chasing after returns in tech stocks, however. We highlight a few factors which could derail the rally:

  1. Stagflation: slowing growth (whether an official recession or not) combined with persistently sticky inflation will both challenge earnings for tech stocks and valuations.  The Fed may be disinclined to acquiesce to the market’s desire for lower rates and the lofty valuations supporting the tech rally may be forced to moderate.
  2. Valuations: investors must not only consider the quality of the companies that they own, but also the price they pay to own those companies.  U.S. “Mega-Cap” stocks (the eight stocks that currently represent almost 25% of the market cap of the S&P 500) are trading at near-record valuations relative to the remaining 492 stocks in the index.

As always, we encourage investors to maintain portfolios that cater to their unique investment time horizon and risk profile.  In the long-term, a disciplined process which focuses on risk management and diversification leads to superior results.

What We’re Reading:

Professor Jeremy Siegel: Summarizing, I Remain Cautious On the Markets

Natixis: Why Everyone’s Talking About…Stagflation

Reuters: Artificial intelligence gives real boost to U.S. stock market

BofA Strategist Says Sell US Stocks as AI Seen Forming a Bubble
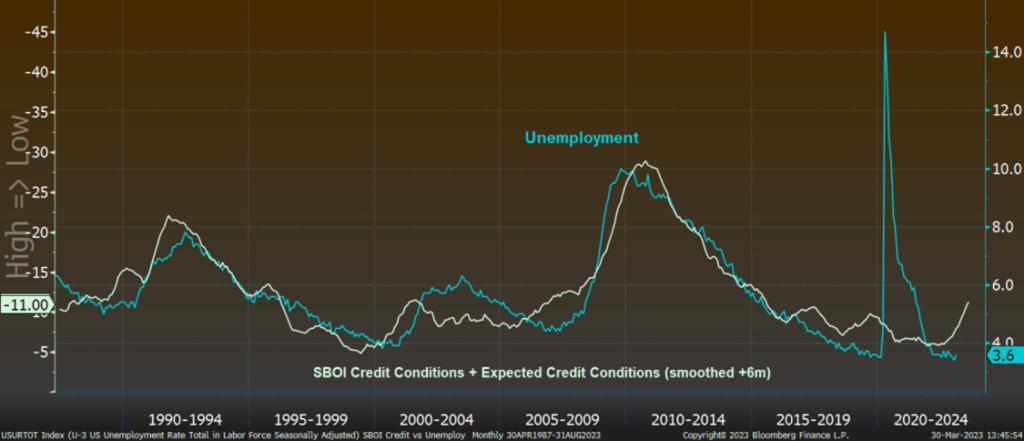
FT: Stonks: Thank you AI hype

Chart of the Week:

Market In a Snap! May 8th – May 12th, 2023

By: Dave Chenet, CFA, CAIA

 CloseWeekly returnYTD return
    
S&P 5004,124.04-0.29%7.41%
Nasdaq Composite12,284.740.40%17.37%
Russell 2,0001,740.85-0.99%-0.94%
Crude Oil70.02-1.43%-12.62%
US Treasury 10yr Yield3.46%  

Source: YCharts, Yahoo! Finance, WSJ

Market Recap

Despite inflation reports which showed the pace of inflation continues to moderate – both as measured by the Consumer Price Index and the Producer Price Index, markets finished the week lower, weighed down by little progress towards resolving the US debt ceiling.  Should congress fail to reach a debt ceiling agreement, the Brookings Institute estimates that the treasury could continue to make interest payments on government debt but would have to cut other outlays by 25%.  [1]Lower government spending would slow economic growth and borrowers may require a higher interest rate to lend to the government, thus leading to lower bond prices and lower stock market valuations.  Lower asset prices and higher borrowing costs would lower consumer and business confidence.  In an economy that many believe may already be on the precipice of recession, failure to reach an agreement would certainly increase recessionary risk.  Even if a deal is reached, the economy would not be out of the woods.  A deal would likely include spending cuts and act as a tightening of fiscal policy – at a point in time when the Fed has just raised borrowing costs and continues its $95b/month reduction in the size of its balance sheet.  Policymakers face a significant challenge – continue fiscal and monetary accommodation to support current growth but risk inflation and lack of progress towards containing ballooning deficits and levels of government debt.  Regardless of the outcome, current low levels of market volatility may prove to be overly complacent.

What We’re Reading:

CBO: Update to Budget Outlook 2023 to 2033

FT: US fiscal alarm bells are drowning out a deeper problem

WSJ: Druckenmiller Warns of Risk of US Hard Landing

CNBC: Jamie Dimon warns panic will overtake markets as U.S. approaches debt default

Chart of the Week:

The Consumer Price Index continued to moderate in April yet remains above the Federal Reserve’s 2% mandate.  As reflected in the chart above, goods inflation has moderated from the COVID-related supply chain issues, yet services inflation remains high.  Core Services inflation will likely continue to moderate (housing and wage growth tend to be leading indicators), yet we believe that it is likely inflation will remain above the level in which the Federal Reserve is likely to cut interest rates.


[1] https://www.brookings.edu/2023/04/24/how-worried-should-we-be-if-the-debt-ceiling-isnt-lifted/#:~:text=choices%20policymakers%20legislated.%E2%80%9D-,If%20the%20debt%20ceiling%20binds%2C%20and%20the%20U.S.%20Treasury%20does,event%20would%20surely%20be%20negative.

Market In a Snap! May 1st – May 5th, 2023

By: Dave Chenet, CFA, CAIA

 CloseWeekly returnYTD return
    
S&P 5004,136.25-0.80%7.73%
Nasdaq Composite12,235.410.07%16.90%
Russell 2,0001,759.88-0.43%0.05%
Crude Oil71.21-6.11%-11.1%
US Treasury 10yr Yield3.45%  
Source: YCharts, Yahoo! Finance, WSJ

Market Recap

A very volatile week in markets saw the major indices rally on Friday to finish the week only modestly lower.  The week was highlighted by the Federal Reserve decision announcement on Wednesday to hike the federal funds rates by 0.25% to 5.0-5.25%.  While the rate increase was largely anticipated, remarks by Fed Chair Powell skewed more hawkish than the market had hoped.  Powell signaled to the market that the Fed intends to remain “data dependent” and will keep the flexibility to continue to hike rates should inflation remain high. 

As depicted in this week’s Chart of the Week, the market has a very different expectation than the Fed.  The current futures pricing reflects a 99.9% probability that the Fed will cut rates at least once by the end of the year and a 97% chance that the Fed will cut by at least two 0.25% decreases.  The median expectation is for the Fed to cut by 0.75% by year-end.  Consistent with market prognostications are economist forecasts; the Atlanta Fed GDP Now forecasting tool estimates that the economy will grow at a 2.7% pace in Q2, vs economist expectations of no growth.

Market rate-cut expectations and economists’ call for stalling growth paint a stark picture for near-term risk assets.  The Federal Reserve has acknowledged that its actions impact the economy through “long and variable lags.” The ongoing bank turmoil and credit crunch may be early indications of building stress in the financial system, however, the Fed has drawn its line in the sand and is messaging that, while a pause may be justified, it has yet to see the case for rate cuts.  Moreover, and under-reported in the financial press, the Fed has been unflinching in its ongoing balance sheet reduction.  History tells us that “Mr. Market” is usually more prescient than the Fed, but, in our view risks to near-term asset prices are mounting.  Investors will be well-served by employing a disciplined approach that is structured around their unique investment time horizon and financial plan. 

What We’re Reading:

Non-Farm Payroll Data Surprises with Strong Performance

WSJ: The Covid-19 Crisis is Officially Over.  Everything changed.

Coucil of Economic Advisers: The Potential Economic Impacts of Various Debt Ceiling Scenarios

Chart of the Week:

Source: CME Group

Market In a Snap! April 24th – April 28th, 2023

By: Dave Chenet, CFA, CAIA

 CloseWeekly returnYTD return
    
S&P 5004,169.480.87%8.59%
Nasdaq Composite12,226.581.28%16.82%
Russell 2,0001,768.99-1.27%0.54%
Crude Oil76.65-0.22%-4.37%
US Treasury 10yr Yield3.45%  

Source: YCharts, Yahoo! Finance, WSJ

Market Recap

Strong earnings results from Meta, Microsoft and Alphabet pushed equity markets higher this week, with the tech-heavy NASDAQ leading gains.  On the economic front, a drawdown in business inventories led to a weaker-than-expected estimate of US economic growth for the first quarter of the year.  Partially offsetting the drawdown in inventory was a strong rise in consumer spending as purchases of motor vehicles and hospitality categories showed a still-tight labor market is encouraging spending.  Included in the GDP data, PCE inflation increased from a 3.6% pace in the fourth quarter to a 3.8% pace at the end of the first quarter.  Core PCE, which strips out food & energy, rose at a 4.9% pace.  Both estimates were above the level that had been anticipated by economists and confirmed to markets that the Federal Reserve is likely to raise short-term interest rates by 0.25% at the conclusion of its meeting next week.

What We’re Reading:

Bloomberg: Americans Go Deeper Into Debt as They Use Buy Now, Pay Later Apps for Groceries

Reuters: Sluggish growth and high inflation leave ECB in tight spot

Reuters: Yuan overtakes dollar to become most-used currency in China’s cross-border transactions

Chart of the Week:

Source: Jefferies

Market breadth has deteriorated, with just 32% of stocks outperforming the overall index.  In a similar fashion to 1999 & 2021, mega-cap tech names have led.   A market rally with such low participation, however, suggests increased market fragility.

Market In a Snap! April 17th – April 21st, 2023

By: Dave Chenet, CFA, CAIA®

 CloseWeekly returnYTD return
    
S&P 5004,133.52-0.10%7.66%
Nasdaq Composite12,072.46-0.42%15.34%
Russell 2,0001,791.510.61%1.85%
Crude Oil77.80-5.81%-3.10%
US Treasury 10yr Yield3.57%  

Source: YCharts, Yahoo! Finance, WSJ

Market Recap

Mixed corporate earnings, political negotiations over the US debt ceiling and signs of a deteriorating US labor market contributed to a mixed week in equity markets.  Worse-than-anticipated results from Tesla and AT&T, combined with a warning about the health of the US consumer from American Express in addition to a pick-up in both initial and continuing unemployment claims brought into-picture dual headwinds of slowing economic growth and a Fed that is anticipated to raise rates an additional 0.25% in early May.  Overseas, European markets continued to push higher, and China’s GDP estimates beat forecasts and showed continued economic acceleration as it emerges from its “Covid zero” restrictions.

Next week will bring a slew of corporate earnings and important end-of-month reports to which the markets will pay close attention as it attempts to discern what the Fed will do at its May 3rd meeting.  Current estimates favor a rate hike, with only a 14% probability of a pause.  Looking out into the future, however, the market is pricing in two rate cuts by year-end. 


What We’re Reading:

FT: Blackstone president warns market is overestimating chance of Fed rate cuts

Reuters: When will US hit its debt ceiling and what happens if country defaults

Chart of the Week:

Forward-looking manufacturing surveys in the U.S. have deviated from those in China.  Strong GDP growth, credit expansion and lower rates are spurring optimism amongst Chinese manufacturers and very strong retail spending is supportive of continued economic expansion, while US indicators point to slower growth.

Market In a Snap! April 10th – April 14th, 2023

By: Dave Chenet, CFA, CAIA®

 CloseWeekly returnYTD return
    
S&P 5004,137.520.79%7.77%
Nasdaq Composite12,123.470.29%15.85%
Russell 2,0001,781.161.50%1.23%
Crude Oil82.662.14%2.98%
US Treasury 10yr Yield3.52%  

Source: YCharts, Yahoo! Finance, WSJ

Market Recap

A busy week for economic data which, on the whole, showed slowing economic growth and moderating inflation pressures pushed equity indices to modest gains.  Inflation data, highlighted by the CPI and PPI reports, came in below expectations with the forward-looking PPI report posting its largest month-over-month decline since the start of the pandemic.  Meanwhile, data on the health of the US consumer was mixed; retail sales fell 1% for the month of March while sentiment data ticked up (from still low levels).  

Also released this week were the minutes from the Federal Reserve March meeting which showed growing concern amongst central bankers that recent banking stress would lead to “a mild recession” later this year.  Troubling, however, was that the report also noted inflation remains “unacceptably high” and that the reduction in inflation was progressing with “slower-than-expected progress.”  While the Fed may be nearing the end of its rate hiking cycle, it may defy market expectations for rate cuts by year-end absent significant deterioration of the labor market, which continues to hold up reasonably well.

Investors will focus on Q1 earnings next week and will hope that strong momentum continues after a solid beat by JPMorgan.


What We’re Reading:

FT: Banking tremors leave a legacy of credit contraction

The Hill: Why the 1980s Recession Haunts the Fed

Chart of the Week:

The tech-heavy NASDAQ index and the Small-Cap Russell 2000 index have deviated in recent weeks, with the NASDAQ significantly outperforming.  Markets may be recognizing that smaller companies have a higher reliance on bank financing and the recent banking turmoil has significantly tightened credit conditions.  Alternatively, investors may be renewing hopes of another tech-driven run despite high valuations and a higher interest rate/inflationary environment.

Market In a Snap! April 3rd – April 7th, 2023

By: Dave Chenet, CFA, CAIA®

 CloseWeekly returnYTD return
    
S&P 5004,105-0.16%7.03%
Nasdaq Composite12,087-1.13%14.91%
Russell 2,0001,754-2.54%-0.05%
Crude Oil80.546.34%0.35%
US Treasury 10yr Yield 3.28%  

Source: YCharts, Yahoo! Finance, WSJ

Market Recap

Stock markets closed for the holiday shortened week on Thursday afternoon (the harder working bond market, however, has a shortened trading day on Friday).  Stocks finished the week lower as PMI & employment data came in weaker than expected.  Importantly, non-farm payrolls are set to be released on Friday morning, after publication of this newsletter.  Economist consensus expectations for the payroll report is to show 240,000 jobs added last month, down from 311,000 in January. Importantly, markets will also keep a close eye on the wage growth data, which is expected to come in at a 0.3% month-on-month gain.  A number below the consensus will support the narrative that the Fed will pause their interest rate hikes.  Hotter than expected wage growth would likely weigh on markets, increasing expectations of more hikes and lowering estimates of corporate profit margins.


What We’re Reading:

Reuters: China March services activity accelerates on new orders – Caixin PMI

WSJ: Stocks Haven’t Looked This Unattractive Since 2007

Liz Annn Sonders: Elevation: Largest Stocks to Market’s Rescue?

Chart of the Week:

The 2-year treasury yield minus the 3-month treasury yield has reached its lowest level in decades. This is a signal that the always forward-looking market is expecting that the Federal Reserve will not only stop raising short-term interest rates but will soon need to cut interest rates.  Falling inflation and signs of financial stress are raising expectations that policy makers will soon need to reverse course.

Market In a Snap! March 27th – March 31st, 2023

By: Dave Chenet, CFA, CAIA®

 CloseWeekly returnYTD return
    
S&P 5004,109.313.48%7.03%
Nasdaq Composite12,221.913.37%16.77%
Russell 2,0001,802.483.88%2.35%
Crude Oil75.676.55%-5.68%
US Treasury 10yr Yield 3.49%  

Source: YCharts, Yahoo! Finance, WSJ

Market Recap

March finished on a positive note, with the S&P 500 advancing 3.5% on the month and 6.4% above the March 10th lows.  Easing concern about the banking sector and slowing inflation gave rise to the hope that the Fed will achieve a ‘soft landing’ – bringing inflation down towards its 2% target without pushing the economy into outright recession.  Under the hood, gains in tech and communication services offset losses in financials and real estate.  Regionally, Emerging Markets outperformed developed markets and bonds finished the month higher as treasury yields fell.

On a quarterly basis, both stocks and bonds were broadly higher.  European markets were the best performer for the second consecutive quarter and have significantly outpaced US stocks over that period as easing recessionary fears, hope of peaking inflation and very low valuations, and a falling US dollar vs the Euro all supported European stocks (in US dollar terms).  

Looking ahead, we are two weeks away from the start of a pivotal earnings season.  Investors will keep a keen eye on companies’ expectations around revenue growth and the impact of higher rates on corporate profits.


What We’re Reading:

Mohammed El-Erian: What happens in the Banking Sector Won’t Stay There

Richmond Fed President Barker: The Need to Be Nimble

Federal Reserve: Senior Loan Officer Opinion Survey on Bank Lending Practices

Chart of the Week:

While the actions from the US Treasury to quell the banking turmoil of the last few weeks may have alleviated the immediate pressure on banks, the economic impact may be yet in its early stages.  Data suggests that banks are tightening lending standards, which is a leading indicator for the health of the labor market.  Should credit conditions remain tight, the likelihood of recession is materially higher.

Market In a Snap! March 13th – March 17th, 2023

By: Dave Chenet, CFA, CAIA®

 CloseWeekly returnYTD return
    
S&P 5003,916.641.43%2.01%
Nasdaq Composite11,630.514.41%11.12%
Russell 2,0001,725.89-2.50%-2.01%
Crude Oil66.34-8.90%-17.34%
US Treasury 10yr Yield3.395%  

Source: YCharts, Yahoo! Finance, WSJ

Market Recap

Major US stock indices finished the week higher amidst volatility driven by continued pressure in the banking sector as both the government and other large banking institutions took action in attempt to provide liquidity to smaller banks facing large outflows and also to shore up confidence in the banking sector as a whole.  In a “flight to quality” trade, investors pushed higher the prices of US treasury bonds and gold this week. 

Investors will be very focused on the Federal Reserve next week to see if the stress in the banking sector will be enough to convince the Fed to pause its rate-hiking cycle.  The Fed knows that fiscal policy impacts the economy on a lag and that its aggressive tightening contributed to the troubles experienced by SVB and others (albeit, poor management and other mistakes certainly were also contributing factors).  The Fed must, however, balance these risks with the risk of giving up ground in its fight against inflation.  Market expectations on the path of the Fed have changed drastically, with the market now expecting the Fed to begin cutting short-term rates by the end of the year.

Our analysis of the data suggests that inflation will continue to moderate as the fiscal tightening continues to depress consumer spending and excessive credit creation.  However, we do not believe that inflation will fall back below 2% in the short-term as short-term rates are still below the level of inflation and the provision of liquidity to the banking sector increases money supply.  While the Fed is very likely close to the end of their hiking cycle, the market may be too sanguine to expect outright rate cuts by year-end.  As such, we continue to have conviction that investors will be well-served by reducing their exposure to non-profitable speculative stocks and seeking the stability of companies with high quality balance sheets, stocks that pay dividends and high quality bonds.  This turmoil will eventually dissipate, but in the meantime, a focus on quality and safety is prudent.


What We’re Reading:

WSJ: Tech Stocks Seem to Be a Haven From the Banking Crisis, for Now

CNBC: Long-awaited Fed digital payment system to launch in July

Moody’s Analytics: Going Down the Debt Limit Rabbit Hole

Chart of the Week:

With the talk around the Fed’s action around increasing the short-term Federal Funds Rate, there has been very little talk about the reducing in the size of the Fed’s balance sheet, which ballooned to just under $9T by mid-2022.  Since then, the Fed has been engaged in a monthly reduction in balance sheet assets, or “Quantitative Tightening (QT).”  QT reversed last week, with the ~$300b in liquidity provided to banks reversing almost 6-months of tightening.

Market In a Snap! March 6th – March 10th, 2023

By: Dave Chenet, CFA, CAIA®

 CloseWeekly returnYTD return
    
S&P 5003,856.78-4.66%0.45%
Nasdaq Composite11,138.89-4.71%6.42%
Russell 2,0001,772.70-8.09%1.02%
Crude Oil76.50-3.61%-4.46%
US Treasury 10yr Yield3.695%  

Source: YCharts, Yahoo! Finance, WSJ

Market Recap

Markets finished the week on a negative tone, as tech-focused lender Silicon Valley Bank (SVB) was shuttered by US regulators.  SVB, the 16th largest bank in the U.S., ran into difficulties as withdrawal requests (a short-term liability to the bank) were backed by a portfolio of long-dated treasury and mortgage backed bonds (long-dated assets).  This liquidity mismatch, coupled with losses associated with the price of the bonds which had been purchased in a lower interest rate environment, prompted a failed attempt by the bank to raise additional capital.  The Federal Deposit Insurance Corporation (FDIC) will step-in to protect the insured deposits (the FDIC insures up to $250,000 SVB per depositor) and oversee the sale of remaining SVB assets to meet uninsured deposits.  SVB represents the 2nd largest US bank failure in history, behind only Washington Mutual in 2008.  The default drove significant losses across all sectors of the US market on Friday.

In contrast, economic news was positive on the margin, with Friday’s Nonfarm Payroll report showing employment rising by 311k jobs in February, higher than the 205k increase economists had expected.  The 6-month trailing average of 343k jobs/month is much higher than the estimated 100k/month additional jobs considered necessary to keep up with growth in the working-age population.  Encouragingly for those keeping a close eye on the likely path of monetary policy, wage growth slowed to a 3-month annualized pace of 3.6% from a 4.4% high.  Slowing wage growth eases upward pressure on inflation.

The broad US stock market has given back its year-to-date gains and is back to levels close to where it began the year.


What We’re Reading:

FT: SVB is not a canary in the banking coal mine

FT: China is right about US containment

Inflation in 2023: Causes, Progress and Solutions – Congressional Testimony of Mike Konczal

Chart of the Week:

One key recessionary warning (amongst many) is the persistent gap between wage growth and the rate of inflation.  The US economy is consumer-driven and consumers are continuing to see inflation eat away at their propensity to consume.  Consumer spending has been supported by the stimulus savings that consumers had put away, but the current personal savings rate and data related to credit card balances suggest that American are increasingly turning to debt to amid higher prices…at a time when higher interest rates mean increase the cost of servicing that new debt.

Advisory services are offered through Presidio Capital Management LLC, Registered Investment Advisers.  Past performance is no guarantee of future returns. Investing involves risk and possible loss of principal capital. No advice may be rendered by Presidio Capital Management, LLC unless a client service agreement is in place.

Exit mobile version
%%footer%%